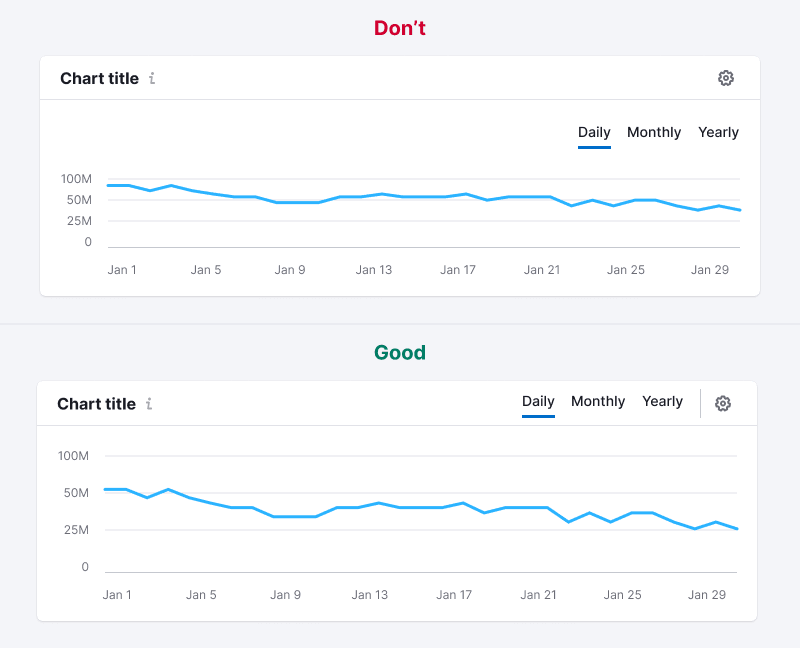
TIP
Basic data visualization rules in widgets with charts are described in D3 chart.
Control types
The widget's controls can be categorized into the following types:
- General controls and filters
- Chart controls
General controls and filters
General controls and filters are always positioned at the same level as the title and include options such as:
- Widget settings
- Chart display settings (smooth or sharp lines, dots or no dots)
- Screenshot settings, and so on.
For widget settings, use a button with use="tertiary" and theme="muted". Remember to add tooltips to all the buttons without visible text.
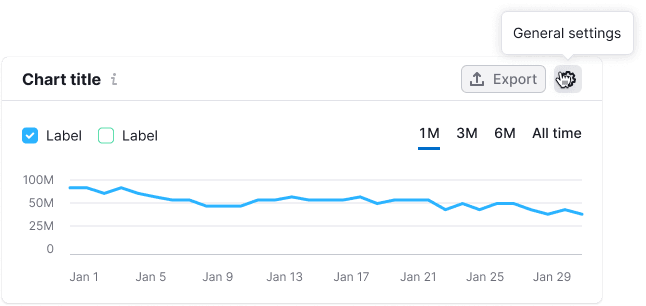
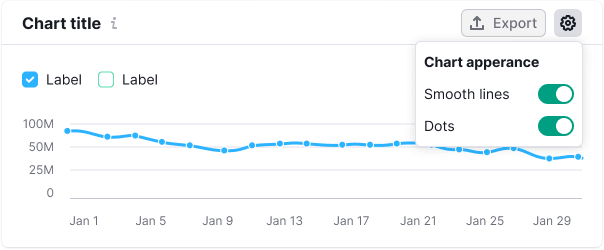
Chart controls and filters
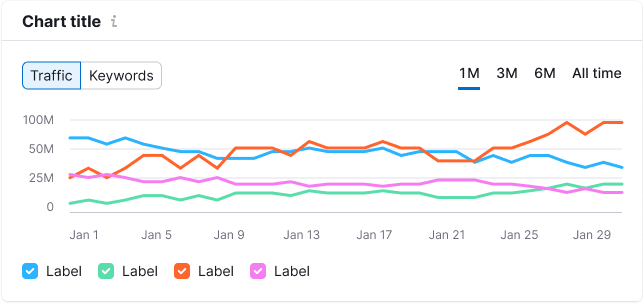
These controls filter the data, axes, and additional controls as described below:
Left-placed controls and filters
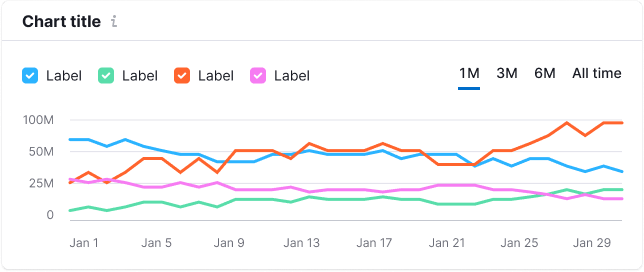
- Legend
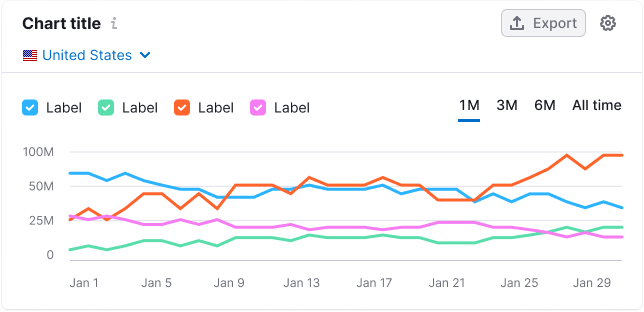
- Country select
- Device (use Select or plain text)
- Notes (refer to Notes module)
Legend
We use various types of legends in our charts. Refer to the Chart legend guide for more details.
TIP
We recommend placing the legend at the top left, above the chart. For charts with numerous filters, position the legend at the bottom left, under the data.
Country and device select
Notes (Notes module)
You can display user, system, or other service-generated notes on the chart. To learn more about this module, refer to Notes.
Right-placed controls and filters
Always place these controls on the right side of the widget:
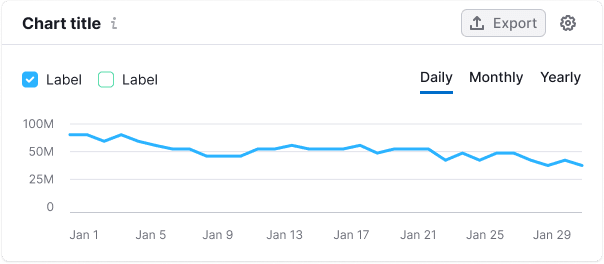
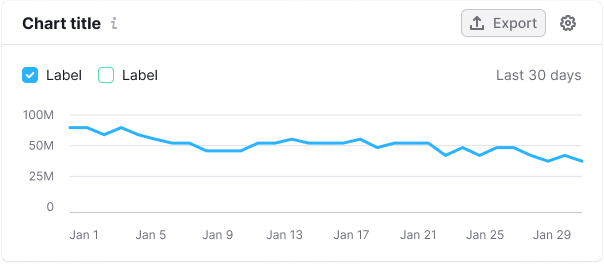
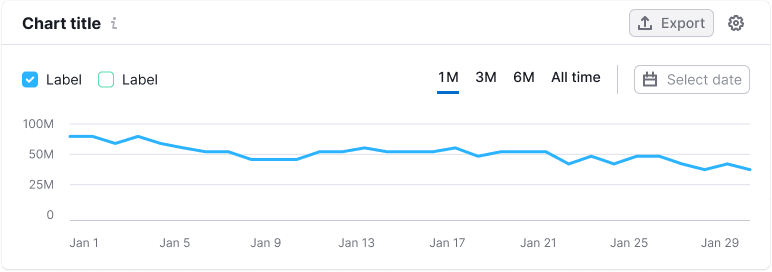
Data period / Frequency
The data period can be represented either by the TabLine or additional text with the --text-secondary color.
Custom period
For custom periods, use the DateRangePicker.

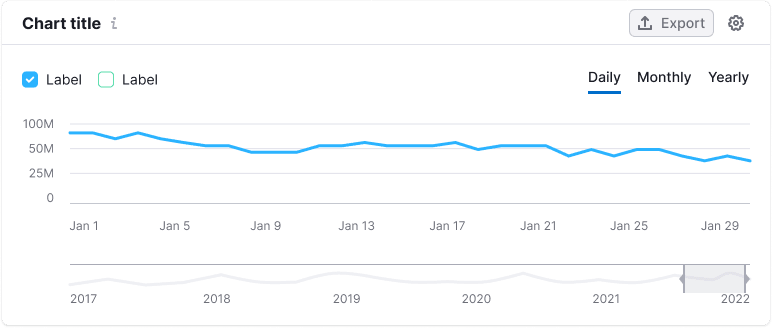
Data frequency (Daily/Weekly/Monthly)

Chart with a zoom
Collapsing rows with controls
You can collapse rows as needed. Different controls or control groups should be separated by a Divider using the --border-secondary token for color and a margin of 0px 16px.
