INFO
Basic data visualization rules are described in the D3 chart.
Description
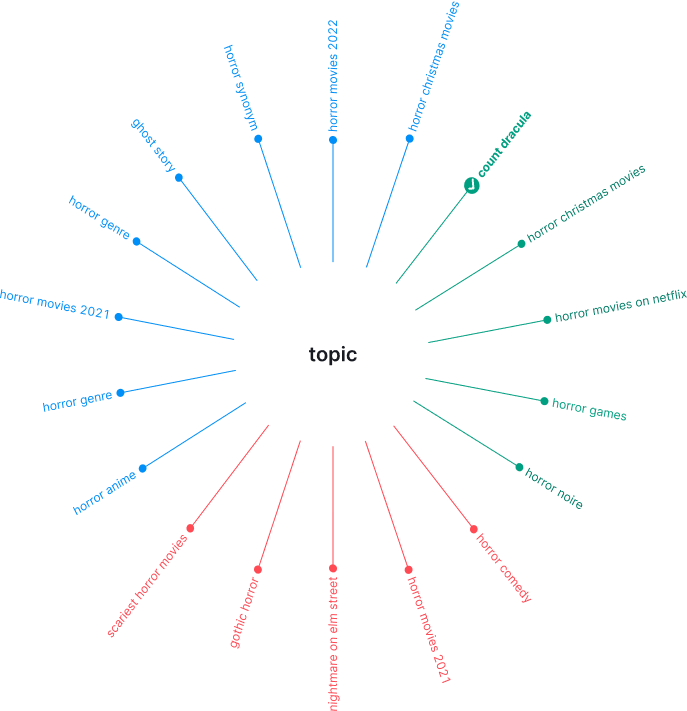
Radial Tree chart is a radial chart for visual organization of information, one of the versions of MindMap. Such a chart in focus always has one central element (idea, phrase, keyword), which starts the search for new related ideas / topics / keywords.
Use this chart when:
- you need to visualize related ideas / topics / keywords;
- you need a tool for pre-analytical hierarchical visualization of ideas/themes/keywords.
Appearance
Basic rules for visualizing data as a Radial Tree:
- There should always be one idea/topic/keyword in the center. Build the rest of the chart from it.
- Keep it simple. The simpler the visualization, the more readable and understandable it is.
- There should be as much space as possible for such a chart. Otherwise, the data will be difficult to read.
| Appearance example | Styles and sizes |
|---|---|
 | The recommended minimum chart size is 600px (don't make it smaller). |
Value's styles
Default state
- Stroke width – 1px.
- Default size of the circle bullet –
8px * 8px. - Font size – 14px (
--fs-200). - In the default state, use 400 hue colors. For example,
--blue-400,--red-400,--green-400, etc.
Active state
- Size of the circle bullet in the active state –
16px * 16px. - You can place an icon of M size inside the circle bullet in the active state.
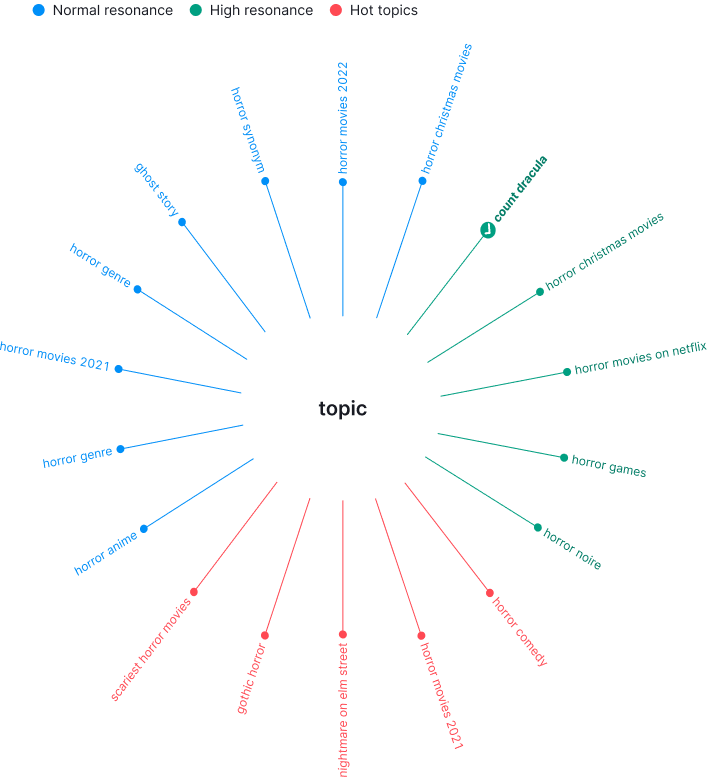
Legend
For cases where you need to group data using colors on a chart, add a legend next to the chart. This will make it easier for users to read the data.

Tooltip
This chart doesn't need tooltip.
Interaction
| State | Appearance example | Styles |
|---|---|---|
| Default | In the default state, use 400 hue colors. For example, --blue-400, --red-400, --green-400 , etc. | |
| Hover | For the text's hover state use the next color hue. For example, --blue-500, --red-500, --green-500 , etc. Don’t change the color of the additional line and the circle bullet. | |
| Active | In the active state, the text has the same color as on hover, but changes its font-weight to 700. For example, --blue-500, --red-500, --green-500 , etc. The circle bullet grows to 16px * 16px size. You can place an icon inside the bullet if needed. |
Animation
All values appears from the center with ease-in and 200ms delay.
The transparency of values appearance changes from 0 to 100 with ease-in and 200ms delay.
Edge cases
One value
Two values
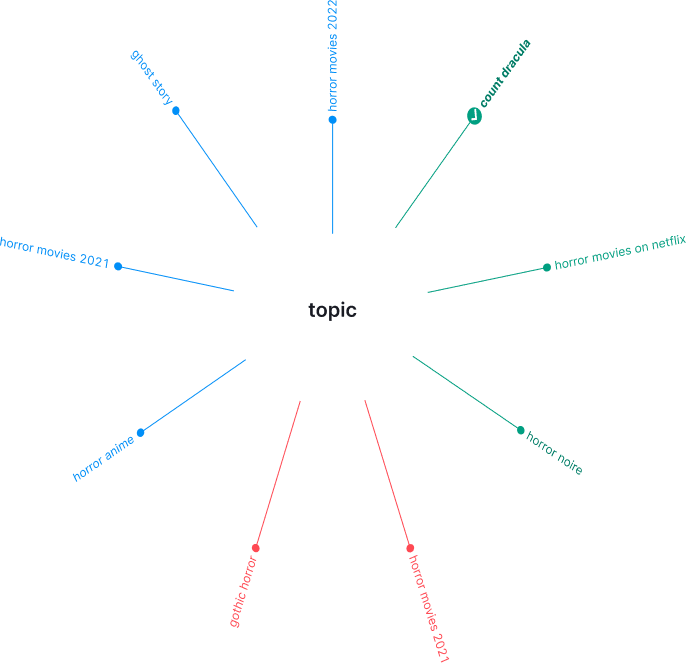
Few values
If there are very few values, then they are evenly distributed around the entire circle relative to the central value in a clockwise direction.

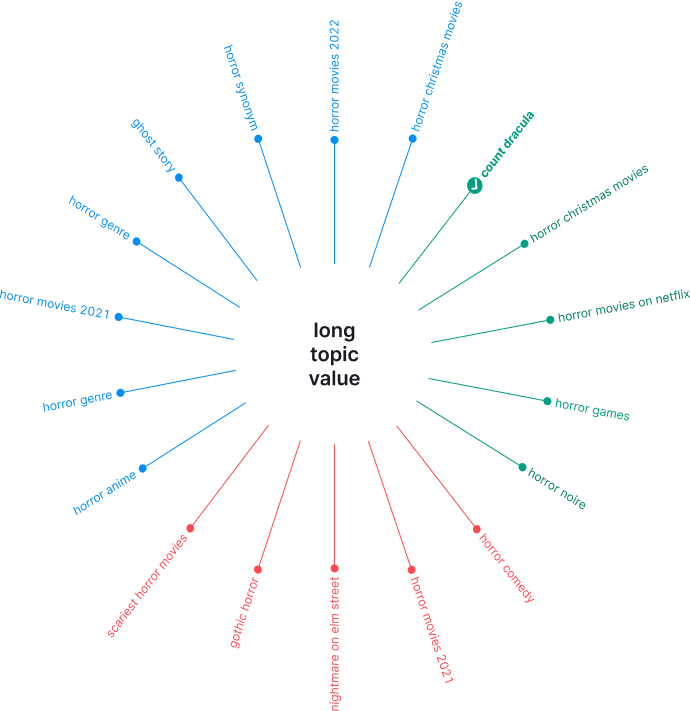
Very long main element
Don't fold the long center value into ellipsis. Wrap it on the second line.

No data
Show a special message for cases when there is no data.
Initial data loading
Show Skeleton during initial loading. If the chart has a title, display it to inform users about what's loading. Refer to Skeleton for more details.
Use the --skeleton-bg color token for the skeleton's background.

Refer to Error & n/a widget states for all other empty states.