INFO
Basic data visualization rules are described in the D3 chart.
Description
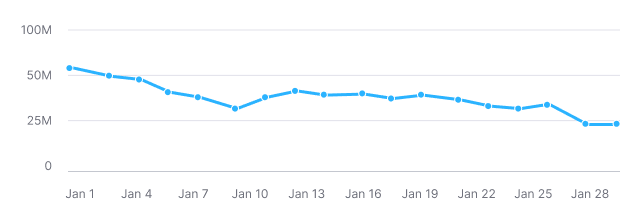
Line chart displays the trend of numeric variables over time, making it ideal for showing changes in data across a specified period.
Key considerations for line chart:
- Ensure the chart's axes are clear, adding labels if the chart name isn't sufficient.
- Simplify the chart by removing unnecessary visuals like excessive lines or colors to avoid distracting the viewer.
- If data doesn't start at zero, consider zooming in on the Y-axis for better readability.
- Limit data sets to 5-7 categories to prevent the chart from becoming cluttered and confusing.
TIP
Refer to materials below, to have insights on choosing between line and area charts:
Appearance
Charts are displayed with non-curved lines by default (without curve property) to make it easier to read exact values.
| Example | Styles |
|---|---|
| Line thickness: 3px. |
Display dots on lines when data points either are few or collected irregularly.
| Example | Styles |
|---|---|
 | Dot has size 8px * 8px and border: 1px solid var(--chart-grid-border). On hover, dot expand to 10px * 10px. |
Interaction
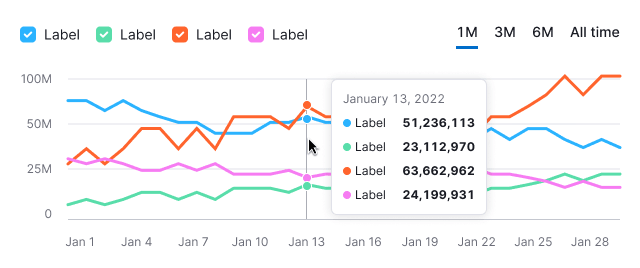
Hovering over the chart displays a vertical guide line at the nearest dot and a detailed tooltip. The guide line color is --chart-grid-y-accent-hover-line.

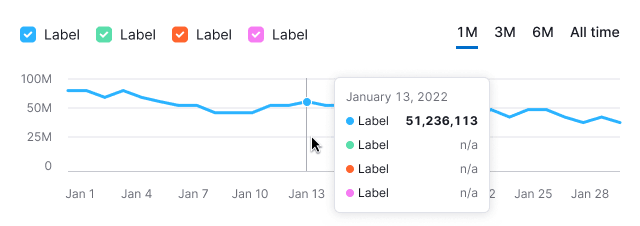
Show a tooltip with n/a for areas without data values.

With many categories, tooltips display dots and values for all under the cursor, maintaining the chart's category order.
TIP
Keep tooltip category order consistent with the chart.

TIP
For detailed tooltip information, see Chart principles.
Edge cases
One value
Display dots by default for charts with a single data point. The line is dashed and colored with --chart-palette-order-other-data.
Two values
Display dots by default.
Example 1 is for two distant dates.
Example 2 is for consecutive dates.
Null values
Display the line at the zero axis if all values are zero.
TIP
Zero counts as data. 0 ≠ n/a.
No data
For periods without data, use a dashed line between known points.

TIP
When there is no data, you can't draw a zero line. Zero counts as data. 0 ≠ n/a.
Display a tooltip with n/a when hovering over a dot without data, and explain why, if possible.

Initial data loading
Show Skeleton during initial loading. If the chart has a title, display it to inform users about what's loading. Refer to Skeleton for more details.
Use the --skeleton-bg color token for the skeleton's background.
Refer to Error & n/a widget states for all other empty states.