TIP
Basic data visualization rules in widgets with charts are described in D3 chart.
Description
Chart legend is a component that helps a user read the data presented on the chart.
Add legend to the chart if there are more than one data set. If there is only one data set on the chart, then don’t display the legend: in this case the purpose of the data should be clear from the chart context: chart title, description, etc.
Component composition
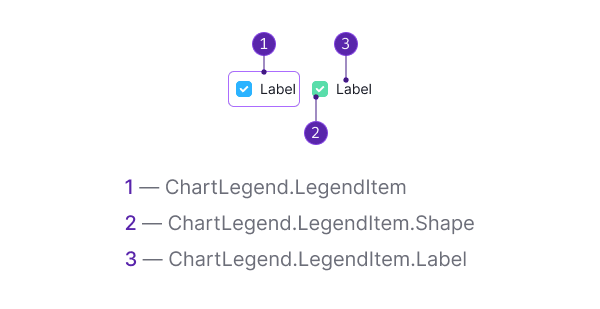
Component consists of the following elements:
ChartLegend.LegendItemChartLegend.LegendItem.ShapeChartLegend.LegendItem.Label
Optionally you can add the following to the LegendItem:
- Leading Icon
- Additional label
- Counter
Placement
The recommended placement of the legend is the top left position above the chart.
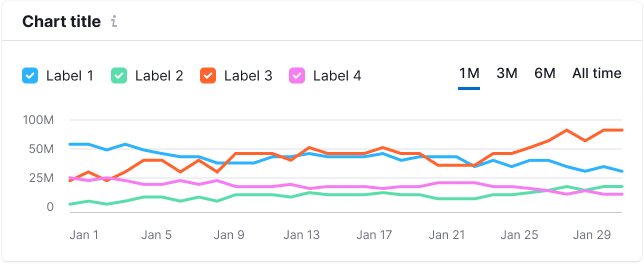
Other placement options
In some cases, you can position the legend either below the chart on the left or to the right of the chart. Here are examples and some possible scenarios:
| Placement | Appearance example | Examples of cases |
|---|---|---|
| right | 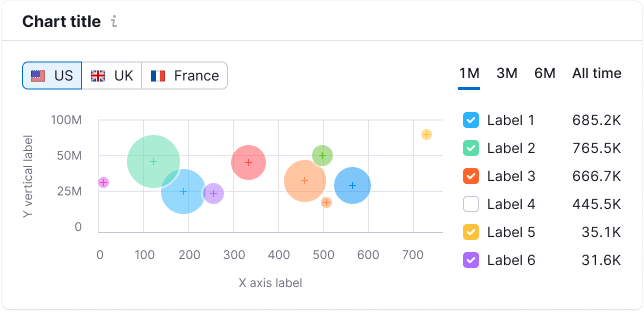 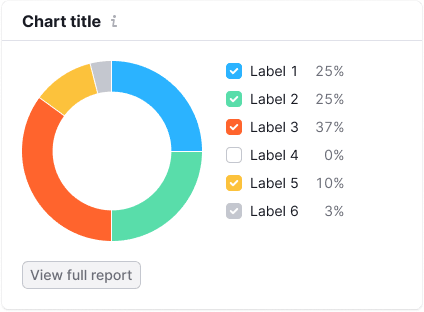 | When the chart is compact and doesn't take up much space or when you want to display legend items in a list for value comparisons. |
| bottom | 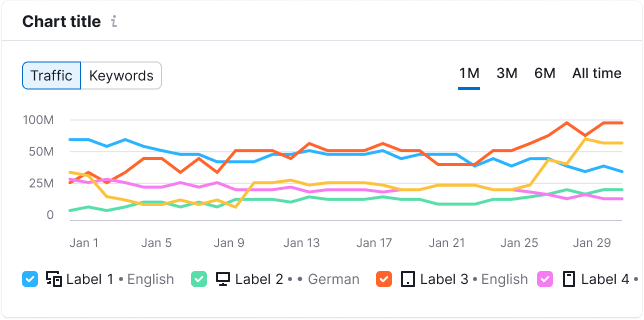 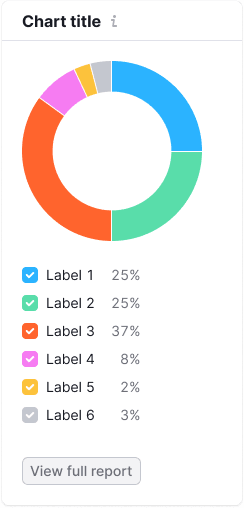 | For instance, when there are multiple filters above the chart or when the chart adapts for smaller screens. |
Legend items
Legend items can be either interactive or static. Use Checkbox for interactive legend items and choose from a list of default SVG shapes (Circle, Square, Line) for static legend items. You can also set a custom shape if needed.
The colors of the checkboxes or shapes correspond to the data on the chart.
All legend items use --text-primary token for color of the text label.
| Shape property | Appearance example |
|---|---|
Checkbox (interactive) |  |
Circle (static) | 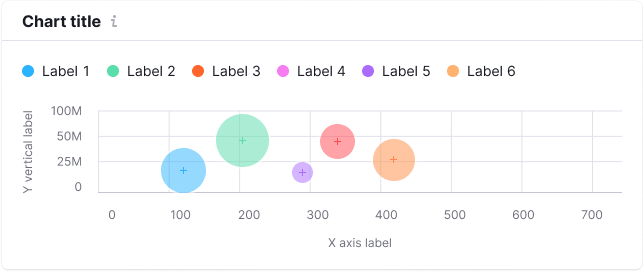 |
Square (static) | 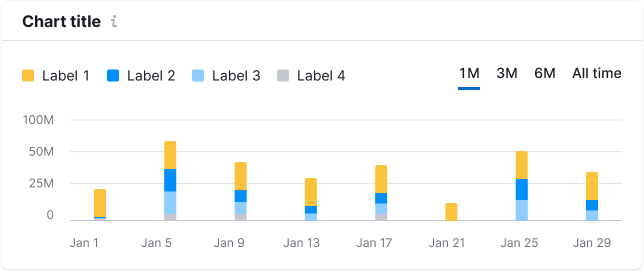 |
Line (static) | 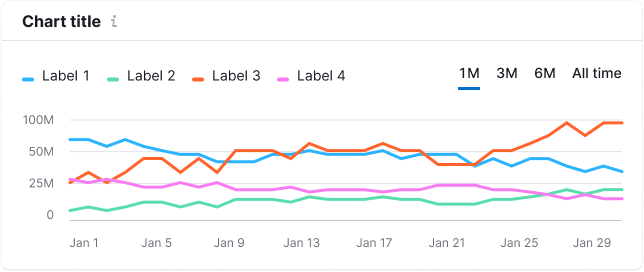 |
Optional legend item elements
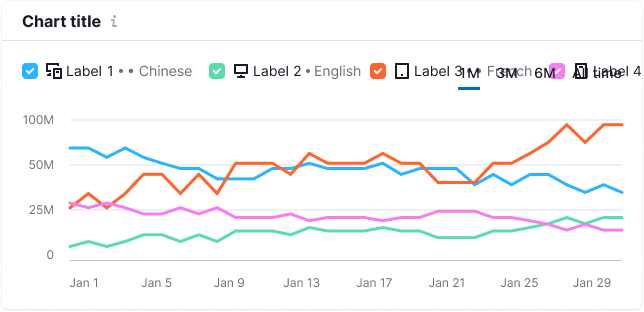
A legend item can include an icon, additional text, a counter, or a combination of these.
| Element | Appearance example | Styles |
|---|---|---|
| Leading icon | Icon has M size and --icon-non-interactive color. | |
| Additional information | 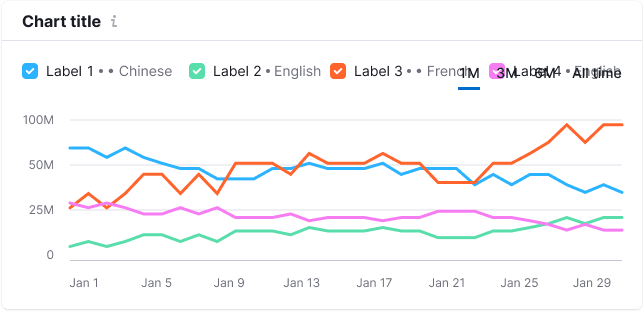 | For additional information, use text with 14px size (--fs-200) and --text-secondary token for color. |
| Counter | 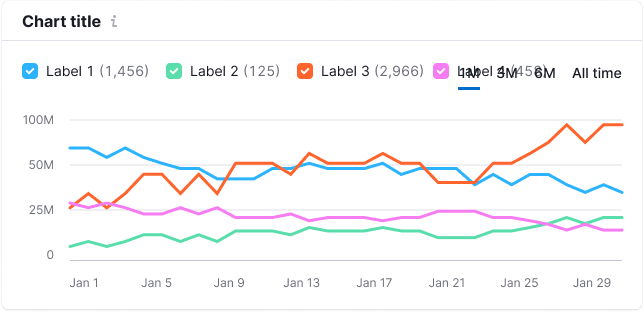 | For a counter, use text with 14px size (--fs-200) and --text-secondary token for color. |
Example of a combination of the elements above:
Trend and average value
To display the trend or average value in the legend, use the withTrend property. It adds checkbox with Divider to separate trend from the main legend.
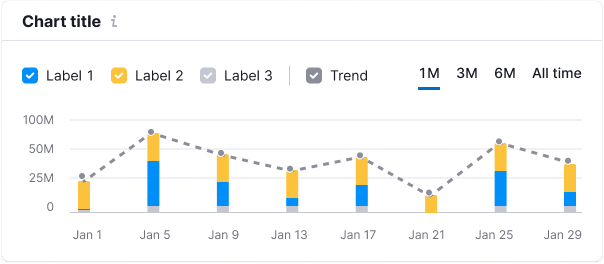
Similarly, you can display total values. Dots on the line are optional.
Interaction
Hovering over a LegendItem can highlight the corresponding data on the chart by reducing the transparency of other data categories to 30%.
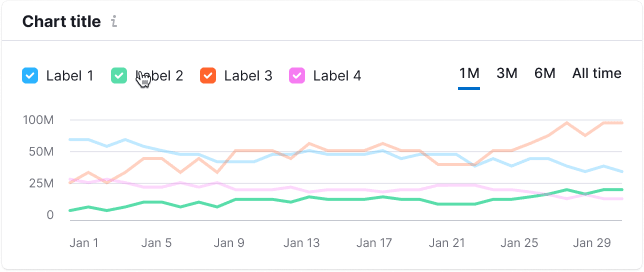
If some data is already disabled in the legend, it should remain disabled while hovering.
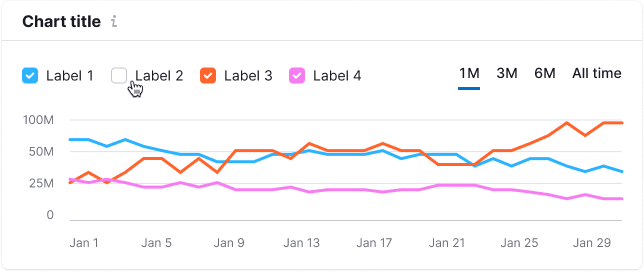
Disabled legend
When all legend items are disabled, the chart should display the X-axis.